
EC50 Determination Assay: A Practical Guide to Measuring Drug Potency
By Rinat Borenshtain-Koreh, PhD, DVM — CEO, Da-Ta Biotech LTD | 25+ Years in Biotech & Biomed R&D
Expert Insight
With over 25 years leading in vitro assay development and in-vivo experiments for global biotech and biomed clients — including FDA application support — I have seen firsthand that a single well-designed EC50 determination assay can make or break a drug’s early-stage trajectory. Potency data is only as defensible as the methodology behind it. This guide distils what a rigorous dose-response workflow must include to produce decision-grade EC50 numbers.
What Is an EC50 Determination Assay and Why It Matters
An EC50 determination assay is the quantitative experiment that defines the concentration of a substance which induces a response halfway between the baseline and the maximum effect of that substance in a biological system. It is the working definition of compound potency, and it sits at the core of every serious drug potency assay performed during early-stage R&D. As an Israeli CRO operating out of the Rehovot Science Park, Da-Ta Biotech: R&D Services For The Biotech and Biomed Industry provides in vitro biological solutions that turn raw dose-response data into decision-grade EC50 numbers.
EC50 is widely treated as the gold standard for ranking new compounds because it is reproducible, model-based, and directly comparable across assays. It is important to keep one distinction clear: potency is the concentration needed to reach the half-maximal response, while efficacy is the maximum response the molecule can produce. Two compounds can share an identical EC50 yet differ dramatically in their plateau — and that distinction often drives go/no-go decisions.
“EC50 is not just a number — it is the biological fingerprint of a compound’s potency. Without it, you are navigating drug discovery without a compass.”
— Rinat Borenshtain-Koreh, PhD, DVM, CEO, Da-Ta Biotech LTD
How Do You Calculate EC50 From a Dose-Response Curve?
Calculating EC50 is a structured process, not a single number pulled from a spreadsheet. It begins with clean data collection across a serial dilution, followed by normalization of the raw signal (commonly 0–100% between negative and positive controls). Concentrations are then log-transformed, which converts a serial dilution into evenly spaced points along the x-axis and produces the familiar sigmoidal dose response curve. Finally, a non-linear regression is fit to the normalized data to extract the half-maximal value.
Log-transformation is preferred because it stabilizes variance across orders of magnitude and makes the inflection point visually intuitive. Modern regression software automates the fit, minimizes human bias, and reports parameters with confidence intervals — which is exactly how a validated analysis pipeline should look.
Step-by-Step EC50 Calculation Workflow
- 1. Data collection: Serial dilution across ≥8 concentrations spanning 3–4 log units
- 2. Normalization: Scale raw signal to 0–100% using negative/positive controls
- 3. Log-transformation: Convert concentration axis for stable variance and sigmoid visualization
- 4. Non-linear regression: Fit 4PL (or 5PL) model; extract EC50, CI, Hill Slope, R²
- 5. Validation: Confirm both plateaus are anchored within measured data points
Which Model Should You Use: 4PL or 5PL?
Choosing the regression model is one of the most consequential decisions in EC50 analysis. The two contenders are the Four-Parameter Logistic (4PL) and the Five-Parameter Logistic (5PL). In the 4PL framework, the EC50 is mathematically defined as the concentration halfway between the lower and upper asymptotes. That clean definition is exactly why 4PL became the working standard. 5PL is a refinement, not an upgrade — it earns its place only when asymmetry is real and reproducible.
What Is the Difference Between EC50 and IC50 Testing?
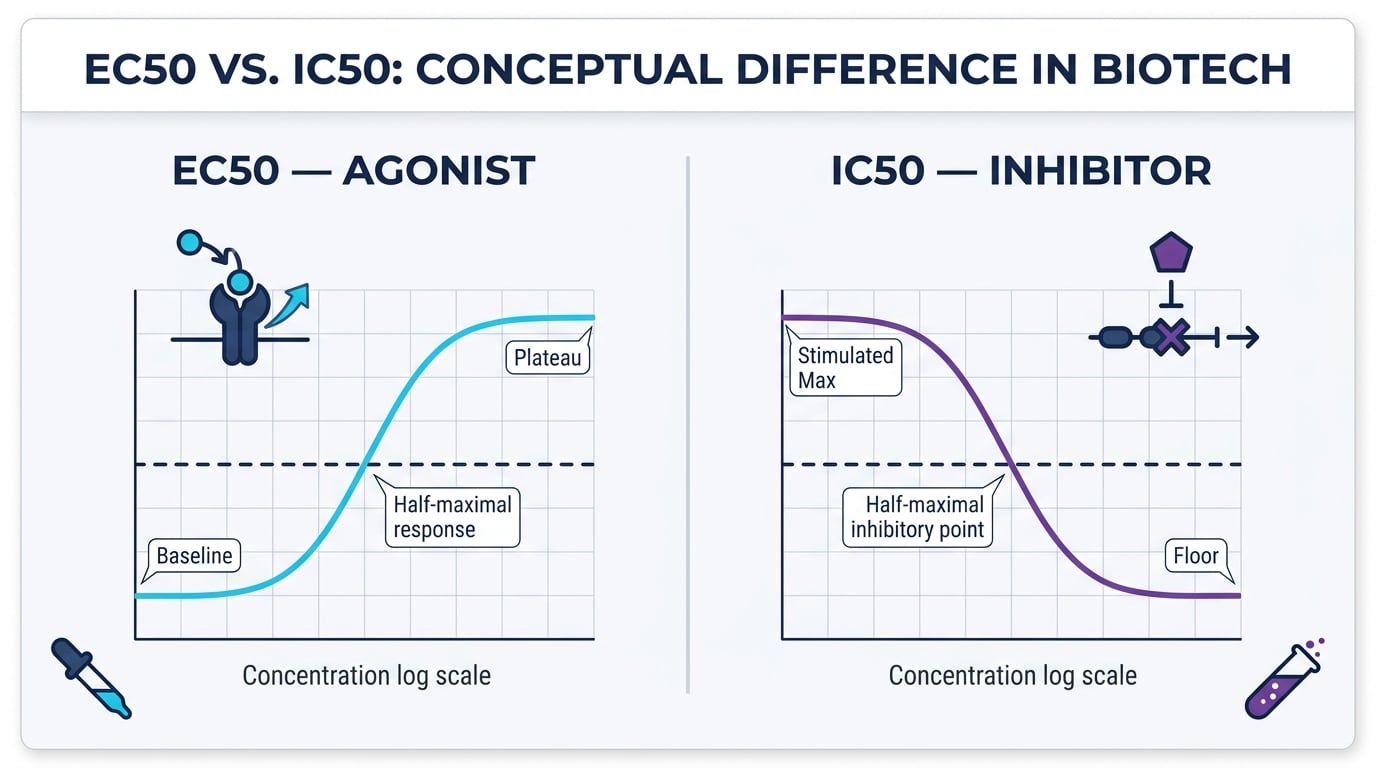
This is the most common confusion in the field, and it has practical consequences for assay design. EC50 (Half-maximal Effective Concentration) is the metric of choice for agonists and activators — molecules that increase a measurable response. IC50 testing (Half-maximal Inhibitory Concentration), in contrast, is used for antagonists and inhibitors — molecules that suppress a baseline or stimulated signal. The regression math is essentially symmetric, but normalization, controls, and biological interpretation differ.
For an agonist, the curve rises from baseline to plateau. For an inhibitor, the curve descends from a stimulated maximum to a floor. Reporting “IC50” for an activation assay (or vice versa) is a red flag in any drug potency assay report. For a deeper treatment of relative vs. absolute potency values, the NIH Assay Guidance Manual is the canonical reference: Data Standardization for Results Management.
EC50 — Agonist/Activator
- Curve rises baseline → plateau
- Measures stimulatory potency
- Positive controls define 100% response
IC50 — Inhibitor/Antagonist
- Curve descends from stimulated max → floor
- Measures inhibitory potency
- Stimulated controls define 0% inhibition baseline
Why Is Hill Slope Critical in EC50 Determination?
The Hill Slope (or Hill coefficient) describes how steeply the response rises across the active concentration range. It is a parameter of the curve, not a cosmetic detail. A slope near 1.0 is consistent with a simple one-site binding interaction; values significantly above or below that range tell a different biological story.
Hill Slope > 1
May indicate positive cooperativity or compound aggregation. Warrants mechanistic investigation before reporting.
Hill Slope ≈ 1
Consistent with simple, one-site binding interaction. The expected result for well-behaved drug candidates.
Hill Slope < 1
Often points to heterogeneous binding sites, partial agonism, or experimental noise. Investigate assay window stability.
⚠ Critical Rule
Robust protocols always report the Hill coefficient alongside the EC50. Reporting one without the other is a half-answer. A Hill Slope that drifts between replicates is an early warning that the assay window is unstable — and the data should not advance until the source of variability is identified and resolved.
Common Mistakes That Compromise EC50 Results
Even well-designed experiments can produce uninterpretable curves. The recurring errors are predictable, and most are avoidable with disciplined planning. The table below maps the most common pitfalls to their consequences and corrective actions.
How Many Concentrations Are Required for an Accurate Drug Potency Assay?
Experimental design is where a drug potency assay succeeds or fails before any pipette is touched. A working rule is the “Rule of 8”: at least eight concentrations spaced across log units, ideally covering 3–4 orders of magnitude around the expected EC50. The goal is to anchor both the upper and lower plateaus, so the EC50 is interpolated within the data — not extrapolated from a curve that never reached saturation.
Replicates matter just as much as point count. Duplicates are a minimum; triplicates provide proper statistical power and tighter 95% confidence intervals. When the assay window is narrow or signal variability is high, the only honest path is more replicates and a refined dilution series.
✓ The “Rule of 8” — Design Checklist
- ≥8 concentration points per compound
- 3–4 orders of magnitude spanning the expected EC50
- Half-log or third-log dilution steps preferred over ten-fold steps
- Minimum duplicates; triplicates for narrow assay windows
- Range-finding experiment before full curve commitment
Scenario: A Curve That Refuses to Plateau
A frequent scenario in the lab: the bottom of the curve is clean, the inflection is visible, but the top never flattens. The fit reports an EC50 — but the value is unreliable. The cause is almost always one of three things: limited compound solubility at high concentrations, cytotoxicity that masks the biological signal, or a concentration range that simply stopped too early.
Cause 1: Solubility Limit
Fix: Adjust vehicle, pre-dissolve in DMSO with controlled final concentration, and verify compound solubility before curve design.
Cause 2: Cytotoxicity Bleed
Fix: Shorten incubation time or run a parallel viability readout to deconvolute on-target effect from cell death.
Cause 3: Range Too Narrow
Fix: Perform a non-negotiable range-finding experiment before committing to the full multi-replicate curve.
“Well-established protocols treat range-finding as a non-negotiable step, not a luxury. An EC50 extrapolated beyond the plateau is an opinion, not a measurement.”
— Da-Ta Biotech R&D Protocol Standard
What Deliverables Should a Professional Lab Provide for EC50 Determination?
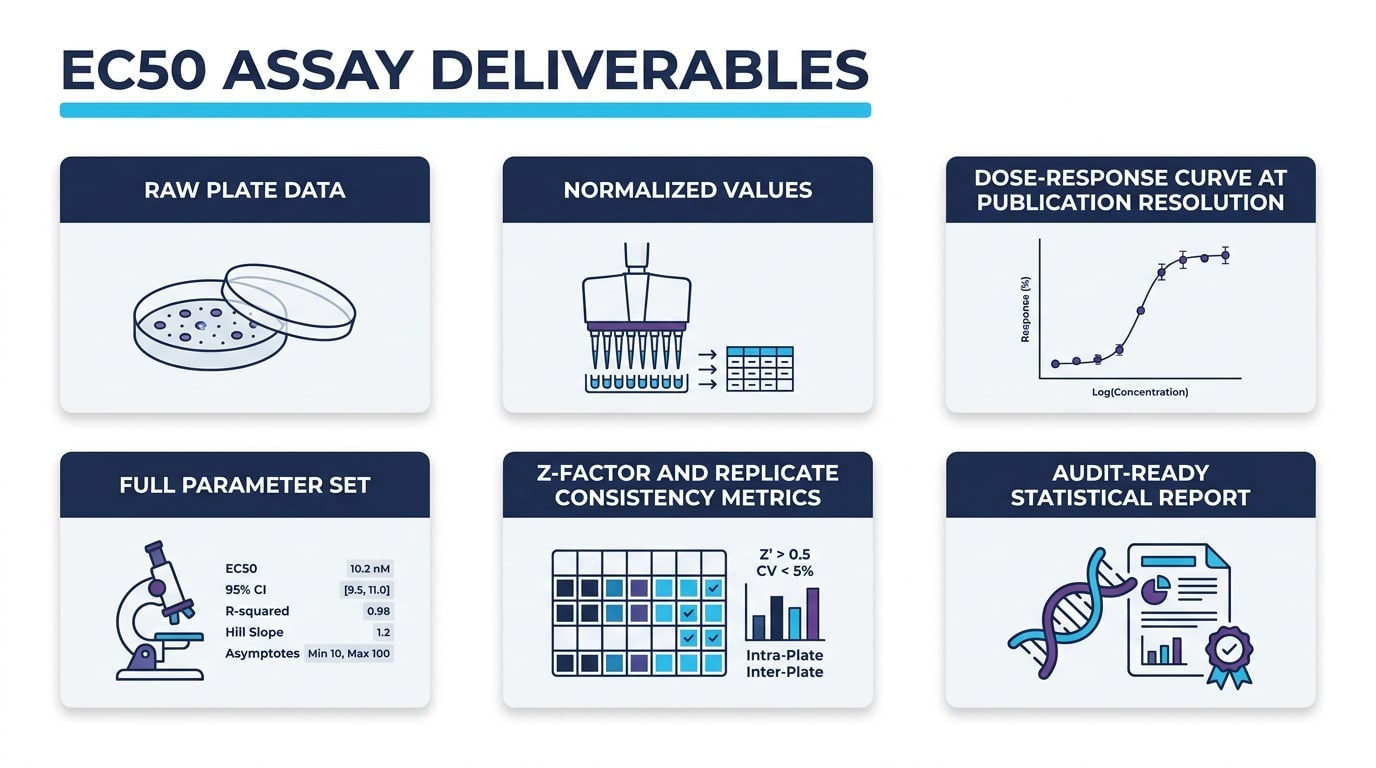
A complete EC50 determination assay report is more than a single number on a slide. Customers should receive raw plate data, normalized values, the fitted dose response curve at publication resolution, and a full parameter set: EC50, 95% confidence interval, R-squared, Hill Slope, and the top/bottom asymptotes. For screening-format assays, the Z’ factor and replicate consistency metrics belong in the report as well.
This level of documentation matters most when EC50/IC50 values feed downstream decisions — for example in cytotoxicity profiling, where the same statistical rigor applies to cell-death readouts. See for context: Cytotoxicity Assays: Measurement Of Cell Death | Da-ta Biotech. The deliverable should let the client reproduce, audit, and defend the number in a regulatory or investor setting.
📋 Da-Ta Biotech Standard EC50 Report Deliverables
Raw Plate Data
All replicate readings, plate maps, and instrument output files in audit-ready format
Normalized Dataset
0–100% scaled values with full control documentation and normalization logic
Fitted Curve (Publication Quality)
Sigmoidal dose-response curve with data points, error bars, and 4PL/5PL model overlay
Full Parameter Set
EC50 ± 95% CI, Hill Slope, R², top/bottom asymptotes, Z’ factor for screening formats
Business Need to Lab Capability: A Practical Mapping
Different stages of R&D ask different questions from an EC50 dataset. The table below maps common business needs to what a tailored in vitro service should provide in practice — reflecting how Da-Ta Biotech structures its engagement model for clients at every stage of drug development.
Quality Checks Before Signing Off on an EC50 Value
Before any EC50 number leaves the lab, a short verification routine protects the data. This is the kind of discipline that distinguishes a defensible drug potency assay from a number that simply looks good on a slide.
5-Point EC50 Sign-Off Checklist — All Must Be “YES”
-
✓
Is the EC50 inside the tested concentration range? (Not extrapolated) -
✓
Are both plateaus defined by real measurements — not by the fit’s imagination? -
✓
Does the Hill Slope sit in a biologically reasonable window? -
✓
Is R-squared above the threshold set in the validated protocol? -
✓
Are replicate curves overlapping within acceptable variance limits?
A “NO” to any single question means the value is provisional. The right answer is to repeat or refine — not to publish.
Frequently Asked Questions
Ready to Design Your Next EC50 Determination Assay?
Whether you are profiling a novel agonist, refining a lead series, or preparing data for a regulatory submission, the quality of your EC50 determines the quality of the decisions that follow. Da-Ta Biotech serves as the β-site for R&D — providing tailored, validated in vitro assays with full statistical reporting and direct scientific dialogue throughout the project.
What scientific challenge can we help you measure next? Come to us with your molecule and your question.